Example Benchmark Figures
Benchmarking Methods for Analysis of RNA-seq Data
The code notebooks provided on this resource allow users to apply multiple normalization, differential gene expression, and enrichment analysis methods to an RNA-seq dataset. Here, we provide example results and visualizations from the analysis of the study GSE159094.
- 4 control samples (human PBMCs with no drug treatment)
- 4 treatment samples (human PBMCs treated with 10^-7M dexamethasone)
Differential Gene Expression Methods for RNA-seq Data
We would expect the target genes of transcription factors bound by dexamethasone to show significant differential expression under dexamethasone perturbation. Because target genes may have increased or decreased expression, gene signatures are ranked by the following values for each method:
- Characteristic Direction: Absolute value of the CD-coefficient
- Limma-voom: Adjusted p-value
- pyDESeq2: Adjusted p-value
- Welch's t-test: p-value
- Log fold change: Absolute value of the log fold change
- Random: Randomly shuffled gene order
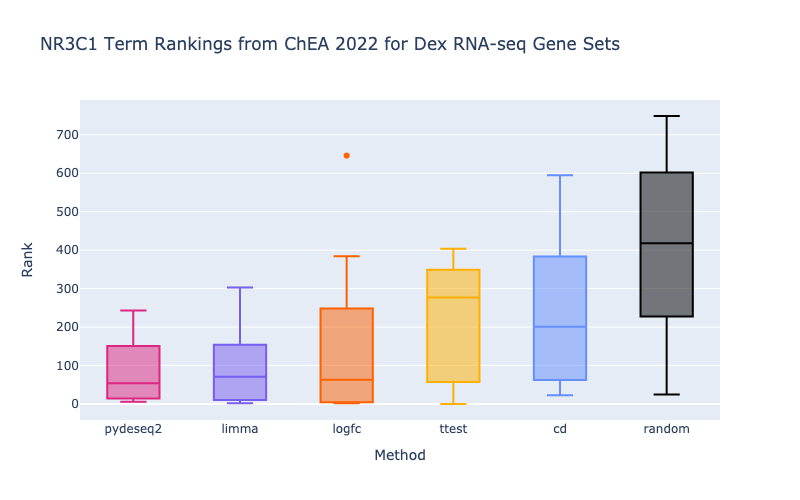
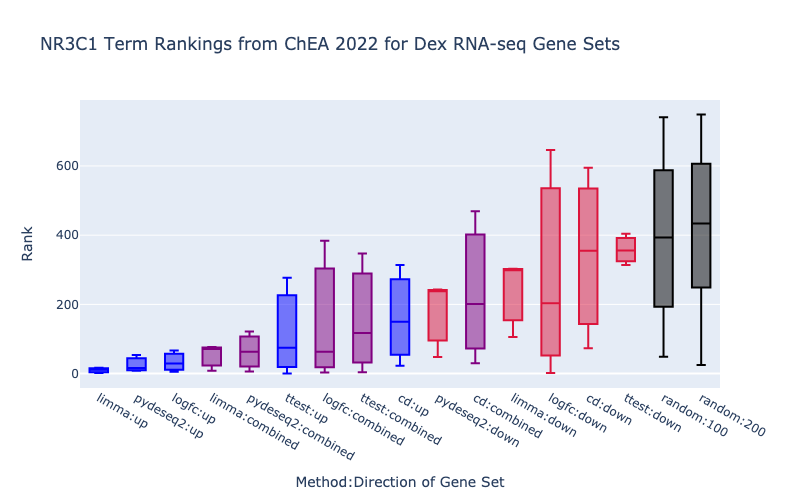
The boxplots display the enrichment rankings of NR3C1-related terms from the Enrichr ChEA 2022 library for gene sets from each method (left) as well as gene sets split by both direction and method (right). The limma-voom (Law et al. 2014; Ritchie et al. 2015) and pyDESeq2> (Love et al. 2014; Muzellec et al. 2022) methods are performing the best at retrieving known target genes of NR3C1. Additionally, since NR3C1 is primarily an activator, we can see a directional effect where up-regulated genes under dexamethasone perturbation are higher ranked than combined and down gene sets.


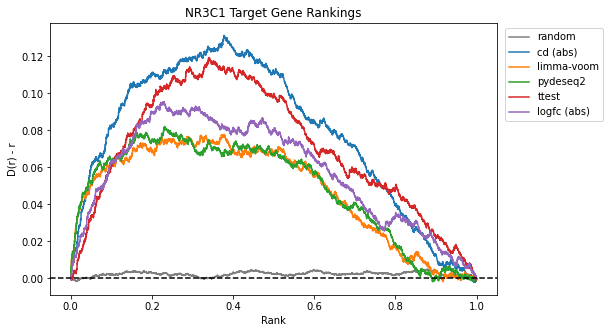
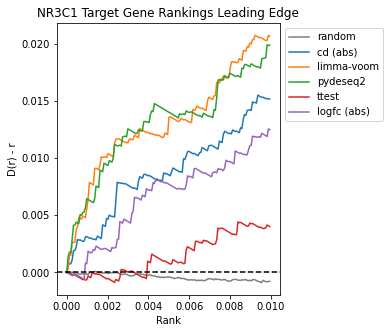
The Brownian bridge plots below show the average rankings of genes from NR3C1, NR0B1, and NR1I2 target gene sets in dexamethasone perturbation gene expression signatures computed using each method. The x-axis represents the gene rank within the signature normalized to [0,1], while the y-axis provides the difference from the uniform cumulative distribution function (CDF), D(r)-r. For more information on Brownian bridge plot visualizations, please refer to our paper on the characteristic direction method (Clark et al. 2014).
Once again, limma-voom and pyDESeq2 appear to recover the most NR3C1 target genes in the leading edge.


References
Clark, N. R., Hu, K. S., Feldmann, A. S., Kou, Y., Chen, E. Y., Duan, Q., & Ma'ayan, A. (2014). The characteristic direction: a geometrical approach to identify differentially expressed genes. BMC bioinformatics, 15, 79. https://doi.org/10.1186/1471-2105-15-79
Law, C. W., Chen, Y., Shi, W., & Smyth, G. K. (2014). voom: Precision weights unlock linear model analysis tools for RNA-seq read counts. Genome biology, 15(2), R29. https://doi.org/10.1186/gb-2014-15-2-r29
Ritchie, M. E., Phipson, B., Wu, D., Hu, Y., Law, C. W., Shi, W., & Smyth, G. K. (2015). limma powers differential expression analyses for RNA-sequencing and microarray studies. Nucleic acids research, 43(7), e47. https://doi.org/10.1093/nar/gkv007
Love, M. I., Huber, W., & Anders, S. (2014). Moderated estimation of fold change and dispersion for RNA-seq data with DESeq2. Genome biology, 15(12), 550. https://doi.org/10.1186/s13059-014-0550-8
Muzellec, B., Telenczuk, M., Cabeli, V., & Andreux, M. (2022). PyDESeq2: a python package for bulk RNA-seq differential expression analysis. bioRxiv doi:10.1101/2022.12.14.520412.