Omics Mining for the Illuminating the Druggable Genome Project
Visually Exploring Clusters of Kinases, GPCRs and Ion Channels based on Co-expression and Co-regulation
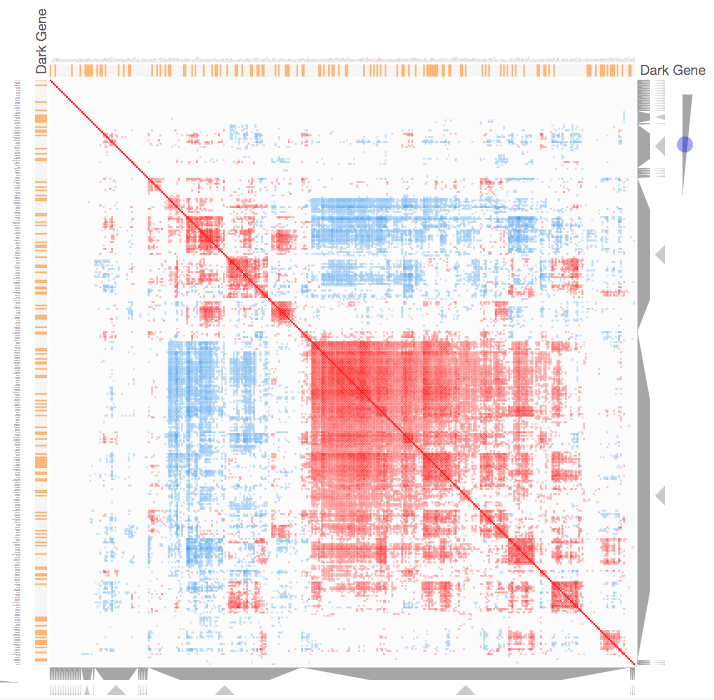
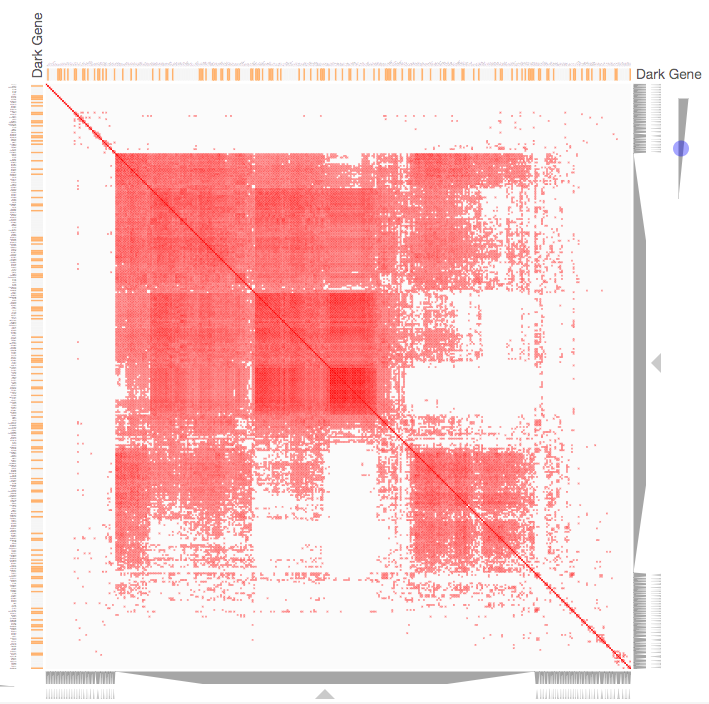
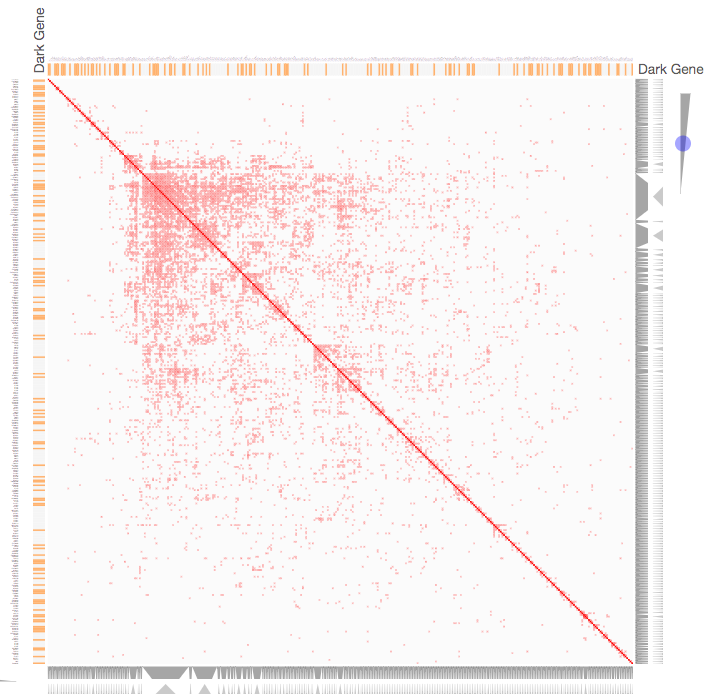
Instructions: The three families of drug targets: GPCRs, ion channels and kinases are clustered by their coexpression based on GTEx or CCLE, or by their coregulation based on ENCODE or ChEA. Under-studied proteins are colored in orange. Such visualization enables the identification of associations between under-studied proteins and their well studied family members. The interactive visualization was implemented using Clustergrammer. To visually explore relationships between kinases, GPCRs and ion channels, select the family and the background data set used to established correlative associations. The visualization is interactive providing zooming and panning, reordering of rows and columns, as well as sorting and searching. Clicking on the trapizoids enables piping the members of a cluster into the enrichment analysis tool Enrichr.
Choose Similarity Matrix
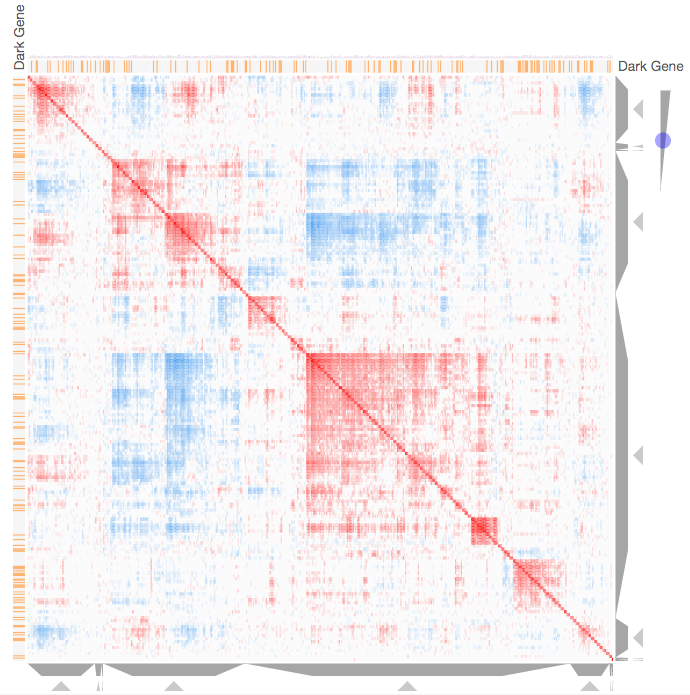
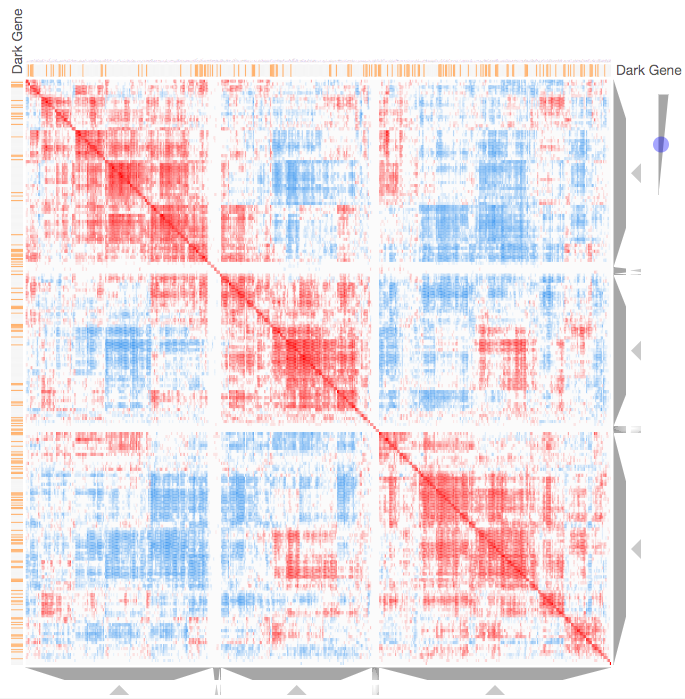
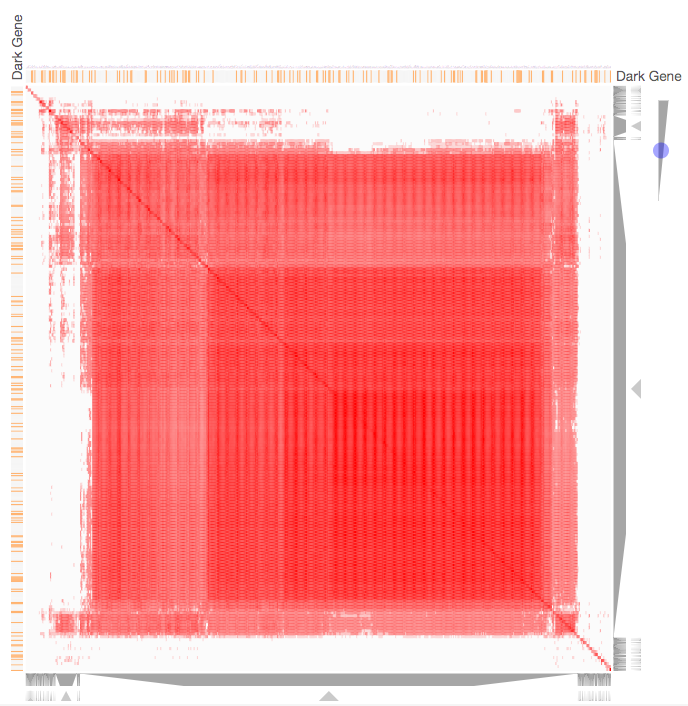
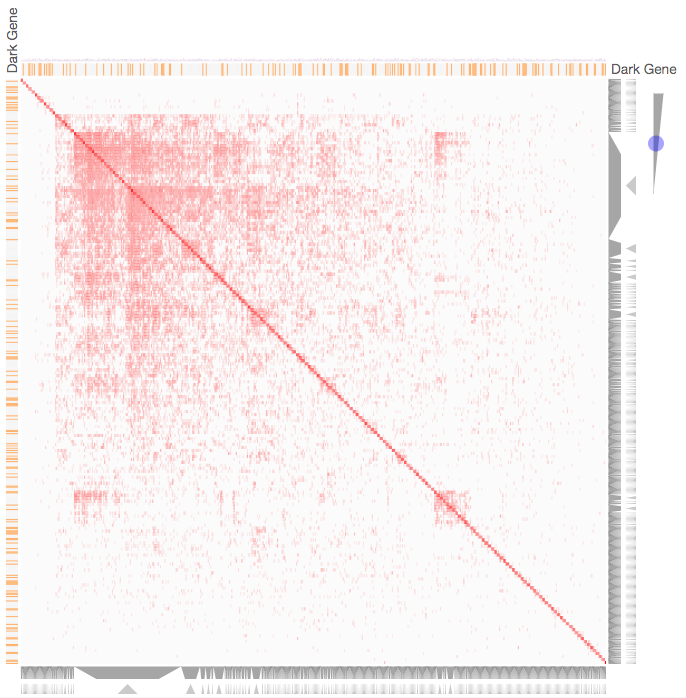
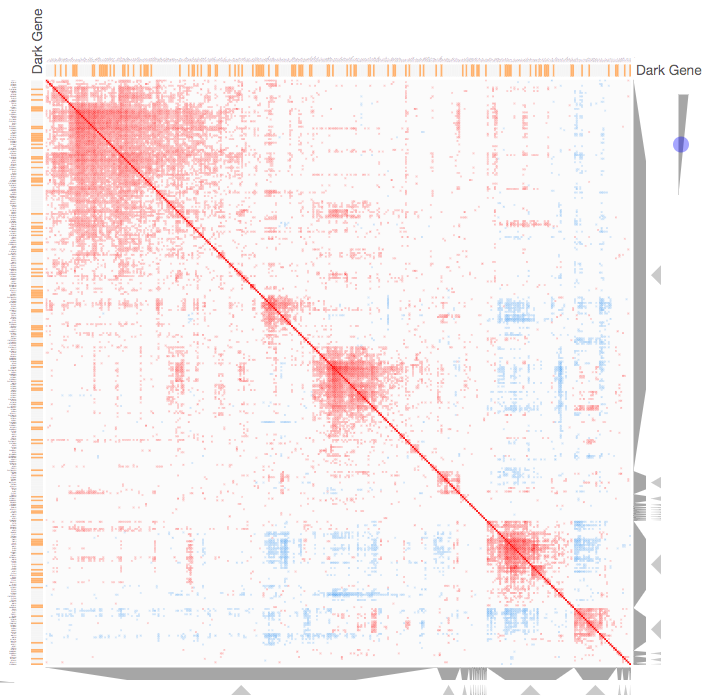
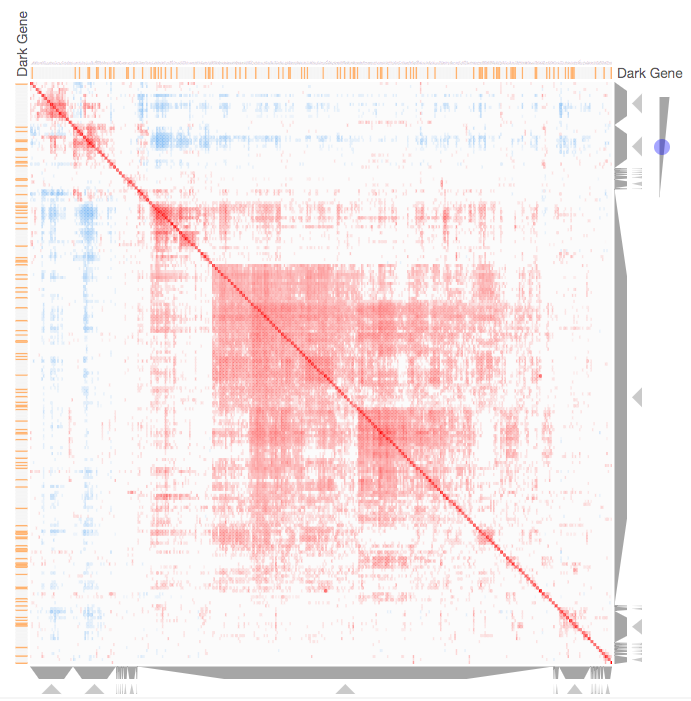
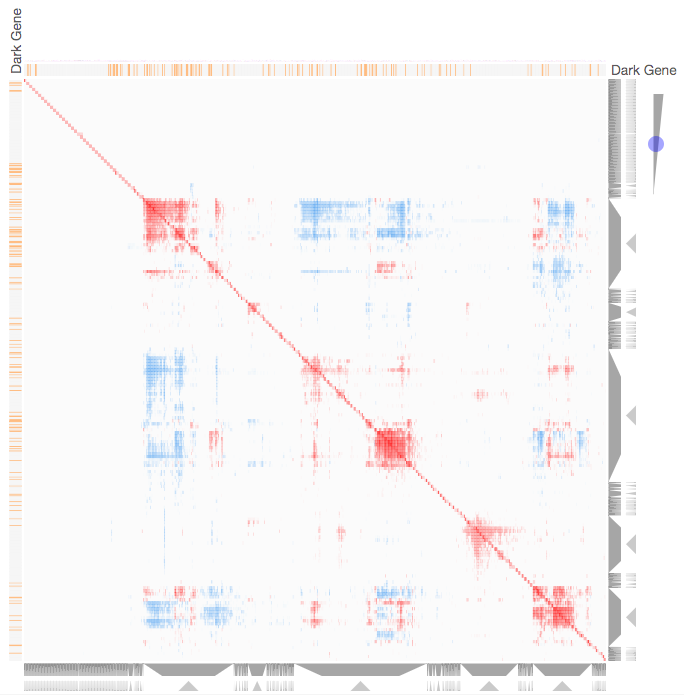
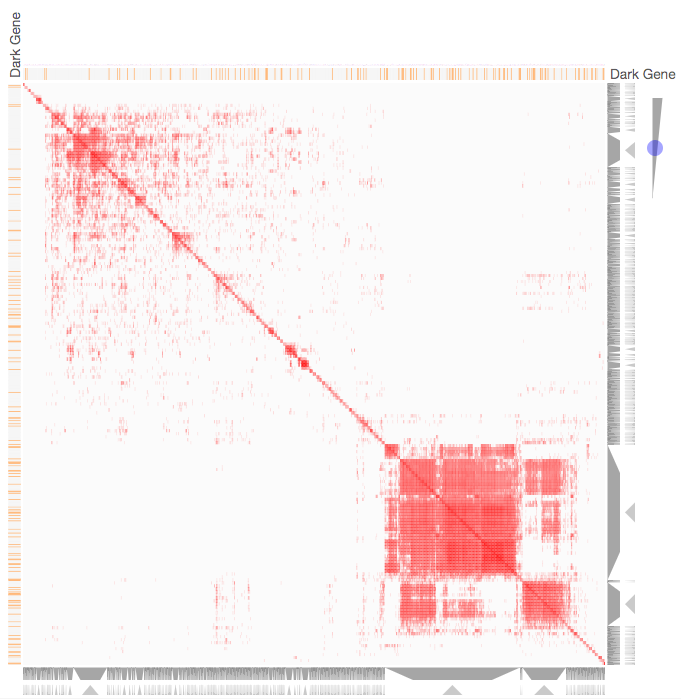
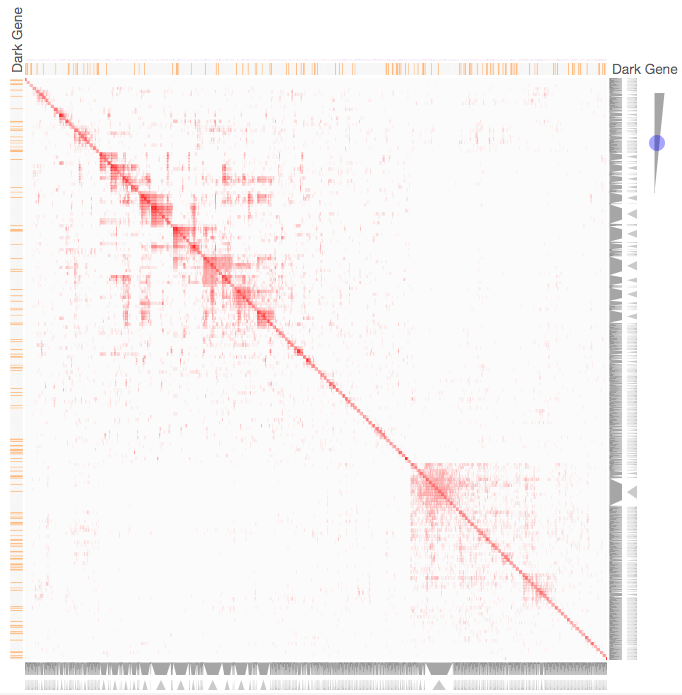
Kinase Similarity based on CCLE Gene Expression